U.S. Arms Sales to Middle East Ballooned During Yemen War
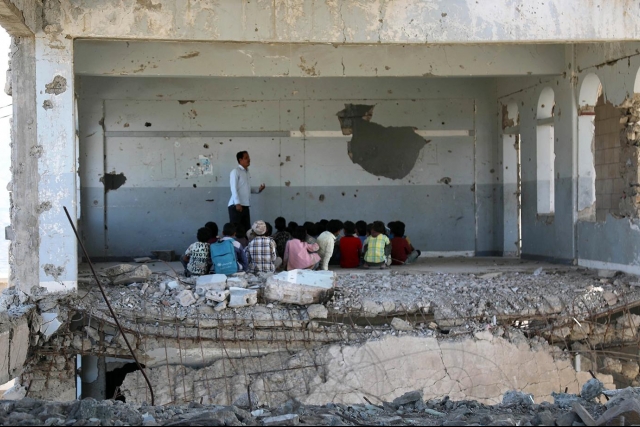
Children attending class on the first day of school damaged by an airstrike in September 2019 (@Human Rights Watch)
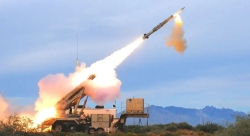
Aircraft, missiles & munitions dominate U.S. arms sales to the Middle East which ballooned during 2015-20, coinciding with the war in Yemen.
Sales of military aircraft overwhelmingly dominate U.S. arms sales to Middle Eastern countries followed by missiles and munitions for the 2015-2020 periods.
U.S. military aircraft sales, comprising those by the Defense Security Cooperation Agency (DSCA) and direct commercial sales by arms vendors amounted to $58.223 billion during the period under study while that of missiles and munitions amounted to $25 billion.
Other major weapons groups sold during the same period are Naval Systems: $25,615; Air Defense and related systems- $29.163 billion; and Land Systems- $7.710 billion.
It was during this time that Saudi Arabia and its allies (U.A.E., Egypt, Qatar, Morocco, and six others) launched the war against Yemen. The Saudi-led intervention was launched in March 2015 in response to calls from the pro-Saudi president of Yemen Abdrabbuh Mansur Hadi for military support after he was ousted by Iran-allied Houthi rebels due to economic and political grievances.
Qatar was suspended from the coalition due to the 2017 Qatar diplomatic crisis; while Morocco ended its participation two years later.
As per a Stockholm International Peace Research Institute (SIPRI) estimate of arms transfer agreements from 2010 to 2014, or just before Saudi set its foot on Yemeni soil, the U.S. exported around $3 billion worth of weapons to the country. Abu Dhabi received around $6 billion worth of weapons during the same period.
In contrast, between 2015-2020, U.S. agreed to sell over $64.101 billion worth of weapons averaging $10.683 billion a year to Saudi Arabia. For the U.A.E. the yearly average for the same period stood at $6.647 billion. Notably, the U.A.E. had requested only $380 million worth of arms from Washington in 2015. For last year, the figure was over 52 times more, or $20.076 billion!
The huge amount spent on munitions replenishment is indicative that they were consumed during the Yemen war.
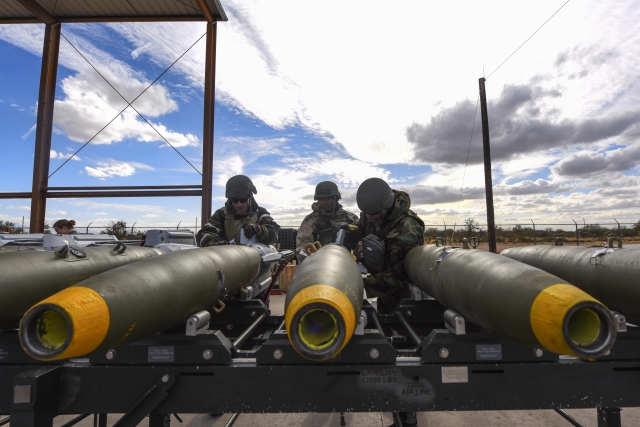
Table 1: U.S. Arms Sales to Middle East Nations 2015-20
(In Green: Deals not mentioned in DSCA but approved by the U.S.)
|
Country |
2015 |
2016 |
2017 |
2018 |
2019 |
2020 |
Total Sales (in $ million) |
|
Bahrain |
150 |
246 |
3,954 |
1,406 |
3,378 |
- |
9,134 |
|
Egypt |
157 |
295 |
- |
1,300 |
554 |
2,877 |
5,183 |
|
Iraq |
395 |
3,000 |
1,355 |
83 |
- |
- |
4,833 |
|
Israel |
1,879 |
300 |
3,100 |
- |
238 |
5,400 |
10,917 |
|
Jordan |
293 |
115 |
- |
- |
- |
323 |
731 |
|
Kuwait |
- |
12,451 |
1,201 |
429 |
281 |
5,685 |
20,047 |
|
Morocco |
157 |
- |
- |
1,259 |
10,257 |
301 |
11,974 |
|
Qatar |
- |
22,285 |
1,100 |
515 |
3,086 |
- |
26,986 |
|
Saudi Arabia |
20,335 |
4,815 |
17,187 |
2,887 |
1,800+4050* |
640+ 9800+657+1970* |
64,101 |
|
Turkey |
70 |
- |
- |
- |
- |
- |
70 |
|
U.A.E. |
380 |
3,976 |
2,225 |
435 |
4,740+4050* |
24,076 |
39,882 |
|
Grand Total |
23,816 |
47,483 |
30,122 |
8,314 |
32,434 |
51,689 |
193,858 |
*Notes:
- An unspecified number of “enhanced” Paveways besides mortar bombs, missiles, and drones were sold to Saudi Arabia and the U.A.E. under an approximately $8.1 billion (taking $4050 million each) “emergency” deal in 2019
- Boeing won $9.8 billion to modernize Saudi F-15 combat aircraft in November 2020
- In June 2020, Raytheon received $2.3 billion for 7 THAAD radars of which two were for Saudi Arabia (=> $657.14 million for two THAAD radars)
- Boeing was awarded $1.97 billion in May 2020 to supply Stand-off Land Attack Missile – Expanded Response (SLAM-ER) missiles to Riyadh
According to Defenseworld.net analysis, while the Arab countries bought more aircraft ($2.566 billion in 2015 to $22.243 billion in 2020); bombs, ammunition, and missiles ($4.420 billion in 2015 to $11.272 billion in 2020) in the last few years, the number of naval and land systems decreased (See Table 2).
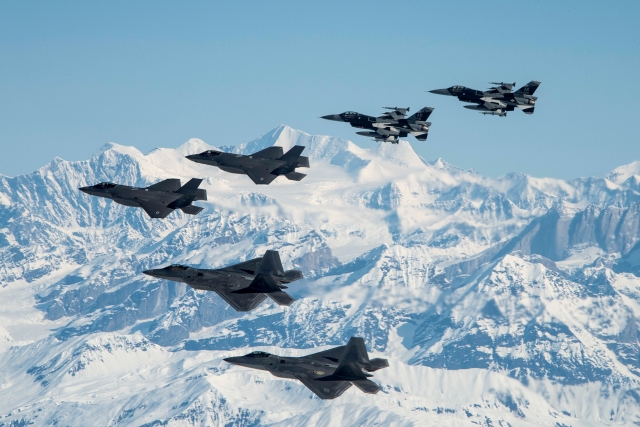
Major purchases by the coalition includes 10 MH-60R helicopters ($1.9B) and PAC-3 missiles by Saudi in 2015; 72 F-15s ($21.1B by Qatar in 2016; F-16 Block 40 jets upgrade ($1.82B) and new F-16Vs ($2.785B) by Bahrain in 2017; THAAD missiles and launchers ($15B) by Saudi in 2017; PAC-3 missiles ($2B) by U.A.E. in 2017; AH-64E Apaches ($1B) by Egypt in 2018; F-16s ($3.787B), F-16 upgrades ($985M), AH-64Es ($4.25B) by Morocco in 2019; Patriot ADS purchases worth $2B by U.A.E. and Bahrain in 2019; and 50 F-35 jets ($10.4B), MQ-9 RPA ($2.7B), AMRAAMs and other munitions ($10B) by U.A.E. in 2020.
SIPRI statement published in March 2020 states that Arms imports by countries in the Middle East increased by 61% between 2010–14 and 2015–19, and accounted for 35% of total global arms imports over the past five years.
Between 2010–14 and 2015–19, exports of major arms from the U.S. grew by 23%, raising its share of total global arms exports to 36%.
Saudi Arabia was the world’s largest arms importer in 2015–19. Its imports of major arms increased by 130% compared with the previous five-year period and it accounted for 12% of global arms imports in 2015–19.
U.A.E. was the eighth-largest arms importer in the world in 2015–19. Two-thirds of its arms imports came from the U.S. during this period.
Collectively, Saudi Arabia and the U.A.E. account for close to 30% of U.S. arms trade worldwide.
“Half of U.S. arms exports in the past five years went to the Middle East, and half of those went to Saudi Arabia,” says Pieter D. Wezeman, Senior Researcher at SIPRI.
Human Rights Watch (HRW), an international non-governmental organization, says it has documented at least 90 “unlawful” Saudi-led coalition airstrikes, including deadly attacks on Yemeni fishing boats that have killed dozens and appeared to be deliberate attacks on civilians and civilian objects in violation of the laws of war. Citing Yemen Data Project report, HRW in 2019 said the Saudi-led coalition conducted more than 20,100 airstrikes on Yemen since the war began, an average of 12 attacks a day. The coalition has bombed hospitals, school buses, markets, mosques, farms, bridges, factories, and detention centers
Data collected by the Civilian Impact Monitoring Project (CIMP) in Yemen shows a total of 348 airstrikes and 570 cases of shelling affecting farms since January 2018, which is an average of almost one incident a day.
As a founding member of the Cluster Munition Coalition, HRW has also collected evidence of cluster bomb attacks in Yemen. Some of the cluster munitions used in the attacks have been identified as U.S.-made BLU-63 antipersonnel/anti-materiel submunitions and components of a CBU-58 cluster bomb. Each air-dropped CBU-58 cluster bomb contains 650 submunitions. Cluster munitions of this type were exported by the U.S. to Saudi Arabia between 1970 and 1995.
Table 2: Different Type of Weapons the U.S. agreed to sell to the Middle East countries
|
Year |
Ammunitions, Bombs, Missiles (in $ million) |
Aircraft (in $ million) |
Naval Systems (in $ million) |
Air Defense (in $ million) |
Land Systems (in $ million) |
|
2015 |
4,420 |
2,566 |
11,640 |
5,400 |
- |
|
2016 |
3,686 |
9,023 |
$279 |
70 |
2,850 |
|
2017 |
137 |
6,770 |
$500 |
17,662 |
849 |
|
2018 |
2,750 |
2,553 |
335 |
- |
2,569 |
|
2019 |
2,737 |
15,068 |
804 |
5,206 |
281 |
|
2020 |
11,272 |
22,243 |
417 |
825 |
1,161 |
|
Total |
25,002 |
58,223 |
25,615 |
29,163 |
7,710 |
